On this page
React Demo Pipeline Pattern
Pattern for building a fully functional demo mode in a React dashboard when the
I built a dashboard for a portfolio project and deployed it. Then I sent the link to someone and realized: the backend was not running. The dashboard loaded, showed empty charts, and threw network errors in the console. The person saw a broken app. That is the moment I decided every dashboard I build needs a demo mode that works without infrastructure.
The pattern I landed on goes beyond showing static mock data. It analyzes user input, selects an appropriate scenario, and simulates multi-stage pipeline processing with realistic delays. The result is a dashboard that feels alive even when no backend exists.
The Architecture
The demo pipeline has three layers: a context provider that determines the current mode, a custom hook that orchestrates simulated processing, and data generators that keep the dashboard widgets updating.
DataModeProvider (context)
  ├── mode: 'live' | 'demo'
  ├── auto-detect: poll /api/v1/health
  └── manual toggle in TopNav

useDemoPipeline (hook)
  ├── analyzeInput(text) → scenario selection
  ├── startPipeline(text) → staged setTimeout
  ├── pipelineState → stage status map
  └── events[] → real-time event stream

DashboardPage
  ├── PipelineWidget (shows stage progression)
  ├── EventStreamWidget (scrolling log)
  ├── MetricsWidget (Recharts time-series)
  ├── IntentDistWidget (bar chart)
  ├── SecurityWidget (pass rates)
  └── SystemHealthWidget (gauges)
The DataModeProvider wraps the entire app and exposes the current mode through React context. Components consume the mode to decide whether they fetch real data or use generated data. The useDemoPipeline hook handles the simulation logic. The widgets do not know or care whether the data is real.
Auto-Detecting Demo Mode
The first design decision was how the app knows it should be in demo mode. I considered three options:
- Manual toggle only — the user clicks a “Demo” button
- Auto-detect only — poll the health endpoint and switch automatically
- Auto-detect with manual override — detect automatically, allow manual toggle
I went with option 3. For a portfolio project, auto-detection is critical because visitors do not know (or care) that there is a backend. They visit the URL, and the app needs to work. But a manual toggle is still useful during development when I want to force demo mode while the backend is running.
The auto-detection polls /api/v1/health on mount and every 30 seconds. If the endpoint is unreachable, the provider switches to demo mode. If it comes back, it switches to live mode. The TopNav shows a small indicator so the user knows which mode is active.
Smart Input Matching
The part that makes the demo convincing is input analysis. When a user types something into the dashboard’s input field, the app does not pick a random scenario. It examines what the user typed and selects a scenario that makes sense.
function analyzeInput(text: string): DemoScenario {
  const lower = text.toLowerCase();

  // Check for PII patterns
  if (
    /d{3}-d{2}-d{4}/.test(text) ||
    /[A-Z][a-z]+ [A-Z][a-z]+/.test(text)
  ) {
    return scenarios["pii-detected"];
  }

  // Check for injection attempts
  if (lower.includes("ignore") && lower.includes("instruction")) {
    return scenarios["injection-blocked"];
  }

  // Check for URLs
  if (/https?:///.test(text)) {
    return scenarios["link-extraction"];
  }

  // Long/complex text
  if (text.length > 200 || text.includes("analyze")) {
    return scenarios["full-pipeline"];
  }

  return scenarios["simple-note"];
}
If someone types a Social Security number pattern, the PII detection scenario activates. If they type something that looks like a prompt injection, the injection-blocked scenario runs. URLs trigger link extraction. Long text triggers the full pipeline. Everything else gets the simple-note scenario.
This creates the illusion that the dashboard is processing input intelligently. The user types something, watches stages light up in sequence, and sees results that relate to what they typed. It is not real processing, but it demonstrates what the processing would look like if the backend were running.
Staged Pipeline Simulation
Each scenario defines a sequence of stages, and each stage has a start delay, a processing duration, and a result. The simulation uses nested setTimeout calls to walk through these stages:
function startPipeline(text: string) {
  const scenario = analyzeInput(text);

  scenario.stages.forEach((stage) => {
    setTimeout(() => {
      updateStage(stage.name, "processing");

      setTimeout(() => {
        updateStage(stage.name, stage.result);
        emitEvent(stage.event);
      }, stage.duration);
    }, stage.startDelay);
  });
}
I considered requestAnimationFrame for the timing, but setTimeout is the right choice here. The delays are intentionally long (hundreds of milliseconds to seconds) to simulate network latency and server processing time. requestAnimationFrame would run at 60fps, which is too fast for this use case and would consume unnecessary CPU cycles.
Each stage transition emits an event to the event stream. The EventStreamWidget shows these as a scrolling log, similar to how a real-time monitoring dashboard works. The PipelineWidget shows colored status indicators that transition from gray (pending) to yellow (processing) to green (passed) or red (flagged).
Data Generators
The widgets beyond the pipeline also need data. Metrics charts, security pass rates, and system health gauges all need numbers that update periodically. Factory functions generate randomized but realistic data:
Metrics follow time-series patterns with small random variations. Security stats hover around realistic percentages (98-99% pass rate, not 50-50). Health gauges show CPU and memory usage that fluctuates within normal ranges. Every 10 seconds, the generators produce fresh values and the widgets re-render.
The 10-second refresh interval is a deliberate balance. Faster updates make the dashboard feel frantic. Slower updates make it feel stale. Ten seconds gives the impression of a live system without overwhelming the user.
When to Use This Pattern
This pattern fits specific situations well:
- Portfolio projects that need to work without infrastructure — visitors should see a functioning app, not error states
- Demo environments for stakeholder presentations — you cannot guarantee network connectivity in a conference room
- Development mode when backend services are down — keep building the frontend without waiting for the API team
- Trade shows or conference demos on unreliable networks — wifi at conventions is notoriously bad
It does not fit situations where the demo could be mistaken for real functionality. If you are demoing to a client who thinks they are looking at a live system, smart demo mode creates a deceptive impression. Label the mode clearly.
Key Design Decisions
| Decision | Rationale |
|---|---|
| Auto-detect over manual-only | Portfolio visitors see demo automatically |
| Smart matching over random | User input feels like it’s being “processed” |
| setTimeout over requestAnimationFrame | Simulates server latency realistically |
| Periodic data refresh (10s) | Dashboard feels alive without overwhelming |
Takeaway
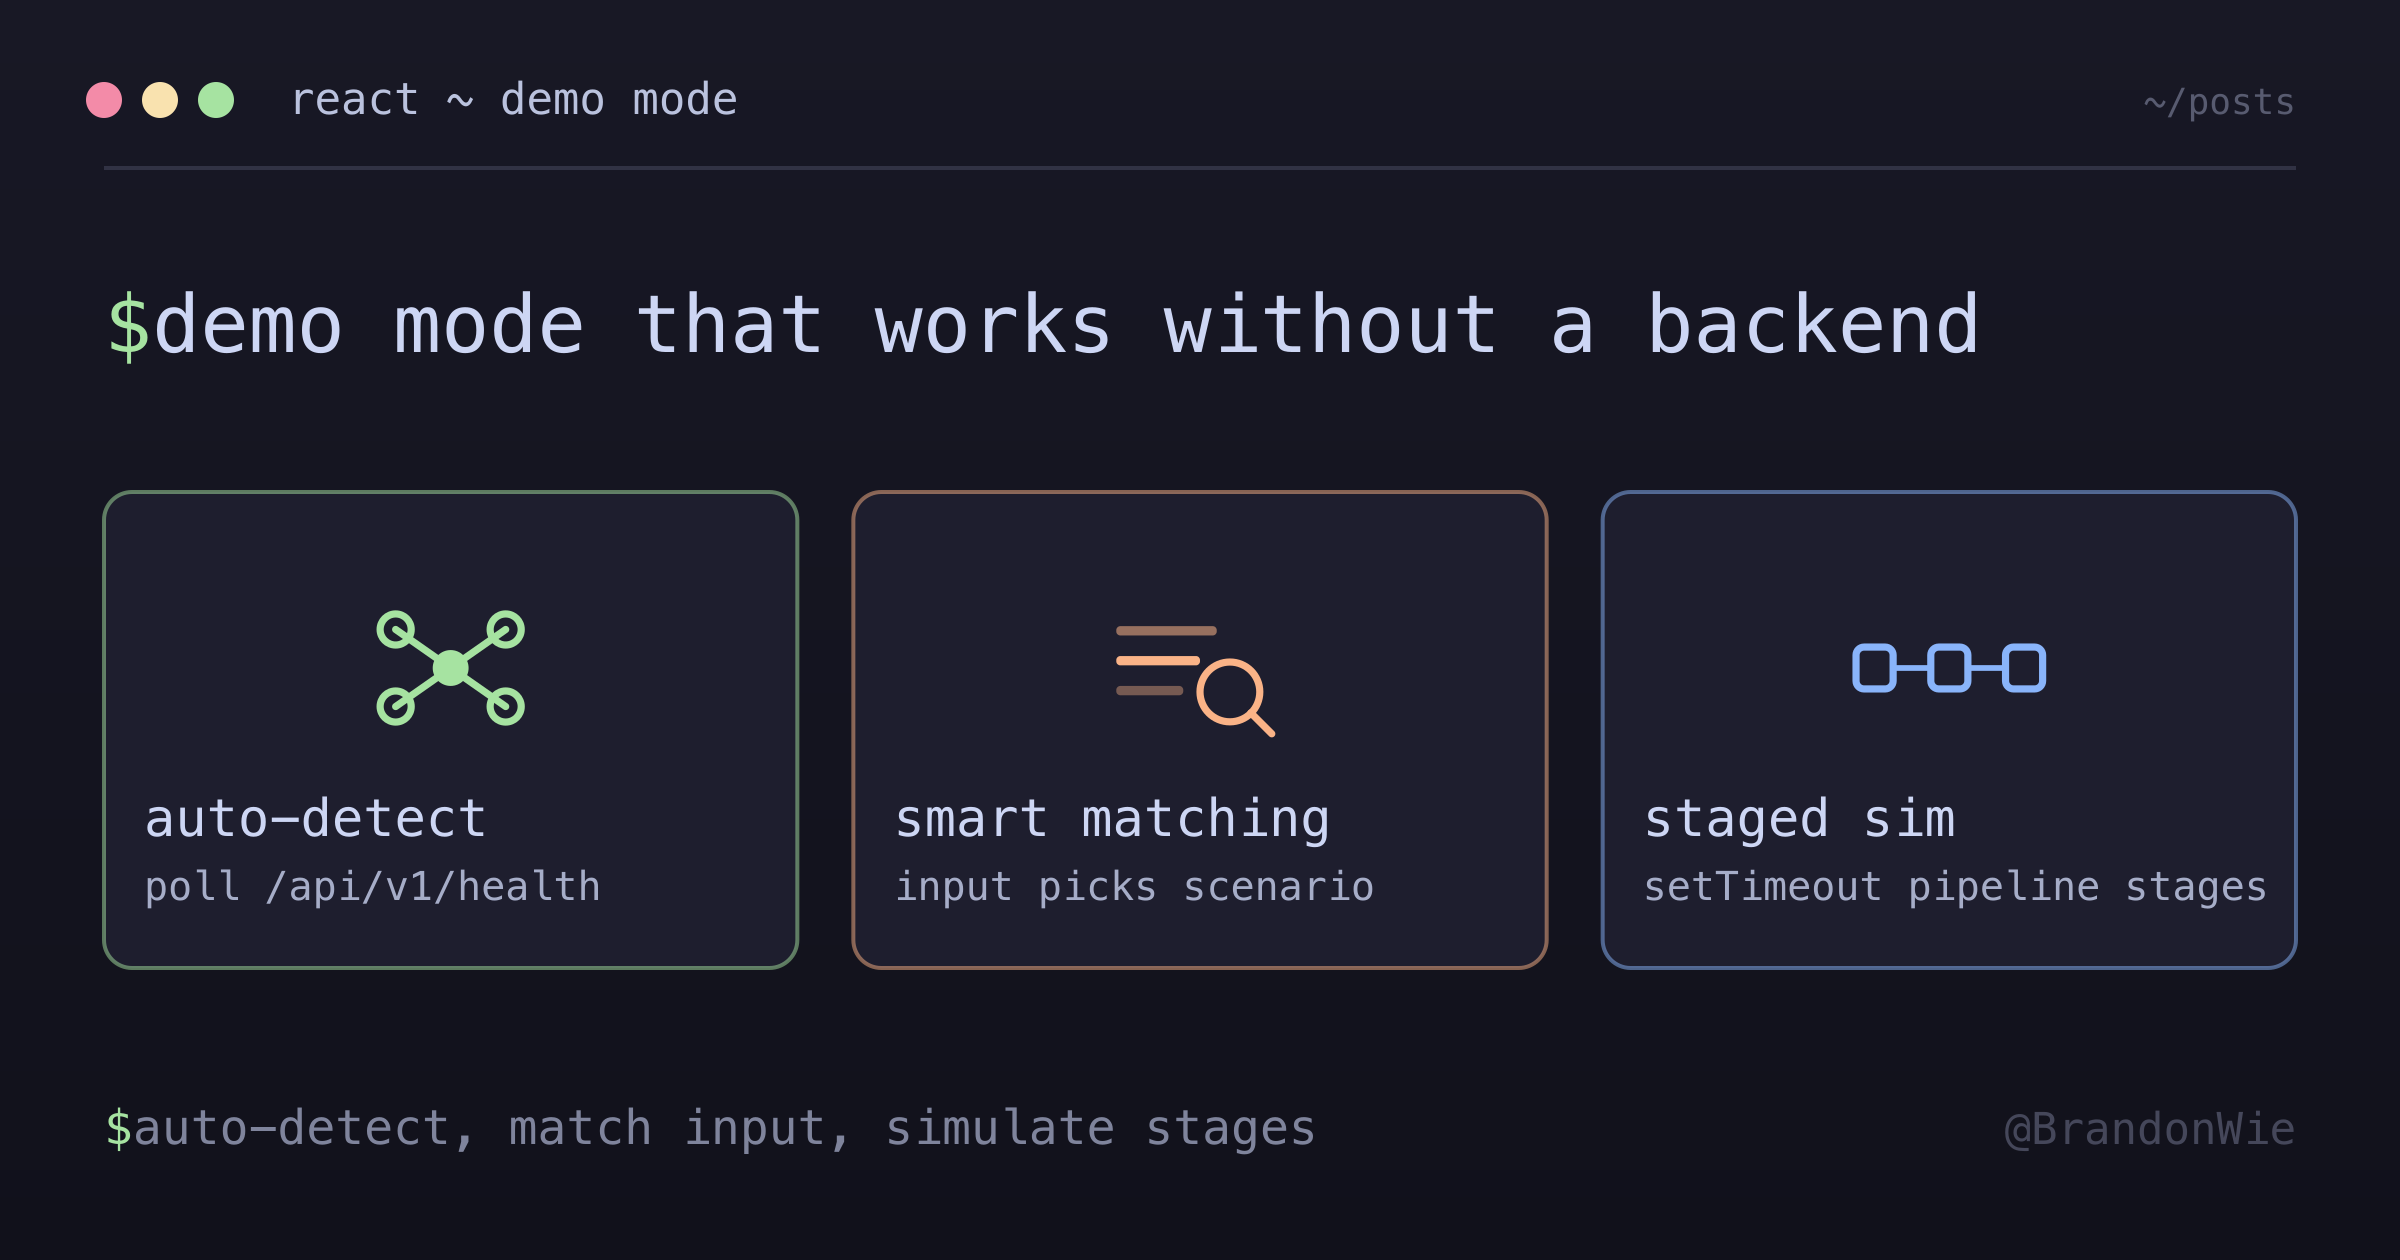
A demo mode is not a nice-to-have for portfolio dashboards — it is the difference between a visitor seeing a working application and seeing a broken one. The demo pipeline pattern gives you a structured approach: auto-detect the backend’s absence, match user input to realistic scenarios, simulate multi-stage processing with visible state transitions, and keep widgets alive with periodic data generation.
The investment is one React context provider, one custom hook, and a set of scenario definitions. The return is a dashboard that demonstrates your work regardless of whether the infrastructure behind it is running.